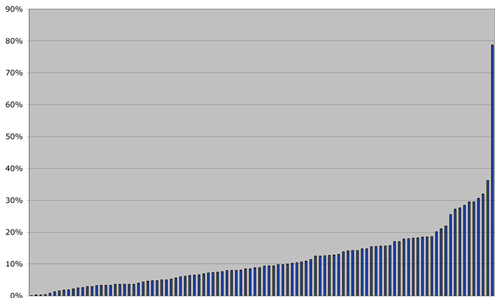
- The 2000 deviation from the ideal, in size, of each House of Delegates district, ordered from most to least ideal.
In 2000, 30% of House of Delegates districts were within 5% of their ideal size of 70,785. Forty five percent were 10% or more away from their ideal size. Fifty nine percent were too small, 41% are too large.
These were the top ten least ideal district sizes, in descending order:
| Delegate | District | Pop. | Deviation |
|---|---|---|---|
| David Poisson | 32 | 126,496 | 78.7% |
| Tom Rust | 86 | 45,130 | -36.2% |
| Bob Marshall | 13 | 93,346 | 31.9% |
| Bill Howell | 28 | 92,446 | 30.6% |
| John Cosgrove | 78 | 91,663 | 29.5% |
| Paula Miller | 87 | 49,877 | -29.5% |
| Chuck Caputo | 67 | 90,871 | 28.4% |
| Kirk Cox | 66 | 90,343 | 27.6% |
| Ken Melvin | 80 | 51,524 | -27.2% |
| Bobby Orrock | 54 | 88,820 | 25.5% |
11am Update: Reader C.T. points out that I’ve inadvertently provided a basis for an expanded and more interesting piece about redistricting. Yeah…I…uh…meant to do that. The above numbers are for 2000 — pre-redistricting — and make a really interesting contrast with the most recent numbers, from 2005 (XLS). (I’ve corrected the above text to prevent confusion.) Below is the 2005 data.

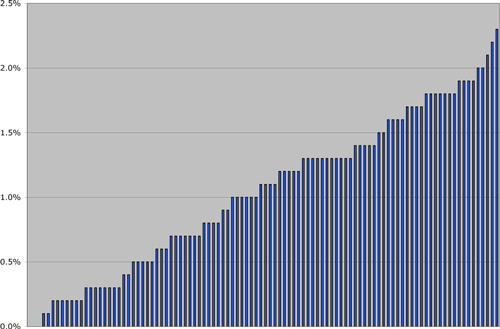
- The 2005 deviation from the ideal, in size, of each House of Delegates district, ordered from most to least ideal.
All House of Delegates districts are now within 5% of their ideal size of 70,785. The outliers are the districts at or above a mere 2% from their ideal size, which number just five.
These are the top ten least ideal district sizes, in descending order:
| Delegate | District | Pop. | Deviation |
|---|---|---|---|
| Terry Kilgore | 1 | 69,144 | -2.3% |
| Steve Landes | 25 | 72,317 | 2.2% |
| Ed Scott | 30 | 69,315 | -2.1% |
| Paula Miller | 87 | 72,192 | 2% |
| Ward Armstrong | 10 | 72,191 | 2% |
| Anne Crockett-Stark | 6 | 72,137 | 1.9% |
| Lynwood Lewis | 100 | 72,110 | 1.9% |
| Phil Hamilton | 93 | 69,465 | -1.9% |
| Michele McQuigg | 51 | 69,418 | -1.9% |
| Terrie Suit | 81 | 72,077 | 1.8% |
Source: “Deviation from ‘ideal district population'” (XLS), Division of Legislative Services.
I think there is an error here, Tom Rust’s district is on the FFX-Loudoun border and is not shrinking at all.
I found the numbers really surprising, which is why I posted them. I’ve never known DLS’ numbers to be wrong, but that doesn’t mean that I’m interpreting them correctly — which is why I posted a link to the original file.
That said, they could be out of date, as there is no date or other identifying on this Excel spreadsheet, named only “sum.xls.”
The 2000 numbers – those are pre-GOP redistricting, right? If so, I wonder how the deviations have changed from the 2001 redistricting plan and the latest census figures.
That’s right, it’s pre-redistricting. I’d love to see a good analysis of how the population has drifted since then, and what the quasi-annual technical adjustments have amounted to.
To answer NLS’s point about Tom Rust’s district. The reason why the deviation was so off is because House District 86 before 2001 located in Hampton Roads, specifically the city of Norfolk. It was the old George Heilig-Donald Williams seat. In any event, the deviation in question does not represent population shift. Rather, it most likely represents efforts by Democratic efforts during the 1991 redistricting to keep as many seats as possible (even if there was not population to justify it) in Democratic areas.
Thanks for that — I’d wondered about that very point. I’m working on structuring a database to look at districts over time, and the difficulty is that, as you point out, districts move and are reshaped radically. So it really requires some pretty intensive GIS to calculate what constitutes a “district” over time. It is, as we programmers say, “non-trivial.” :)
I’m pretty sure that 45,000 number is the Fairfax portion only. It’s just not possible, his district is one of the faster growing ones in the state.
NLS — You must not be reading the thread. The 45,000 has nothing to do with Fairfax County. District 86 was not in Northern Virginia for the time period in question. It was in Norfolk.
My bad, I thought people were talking about something else. I see now.